World City: Manufacturing Industries of New York
Map Reading
Social Studies

Essential Questions
- What can maps tell us about industry and jobs in New York City?
- What is unique about manufacturing in New York City in the early 20th century?
Objectives
- Students will learn how to read a map using protocol.
- Students will use details from the map to make connections to the time-period.
- Students will learn that in the early 20th century New York City had many different small manufacturing companies, rather than huge industries that dominate other cities like Detroit.
Standards
CCSS.ELA-LITERACY.RH.11-12.1
Cite specific textual evidence to support analysis of primary and secondary sources, connecting insights gained from specific details to an understanding of the text as a whole.
CCSS.ELA-LITERACY.RH.11-12.7
Integrate and evaluate multiple sources of information presented in diverse formats and media (e.g., visually, quantitatively, as well as in words) in order to address a question or solve a problem.
C3: COMPARISON AND CAUSATION
Identify any similarities and differences among historical developments over time and in different geographical and cultural contexts.
- Introduction
- Map Analysis Protocol
- Discuss
Procedures
Introduce a series of maps to the students and have them compare and contrast the information that they glean from the map. Some examples can be found in the Museum’s Collection’s Portal. Different types of maps may include the subway map, traffic maps, geographical maps, and historical (hand drawn) maps. Ask them: How do they start to read a map? What do they look at first? Lead a brief share-out of their approaches, then transition to sharing the approach for the day: the Map Analysis Protocol.
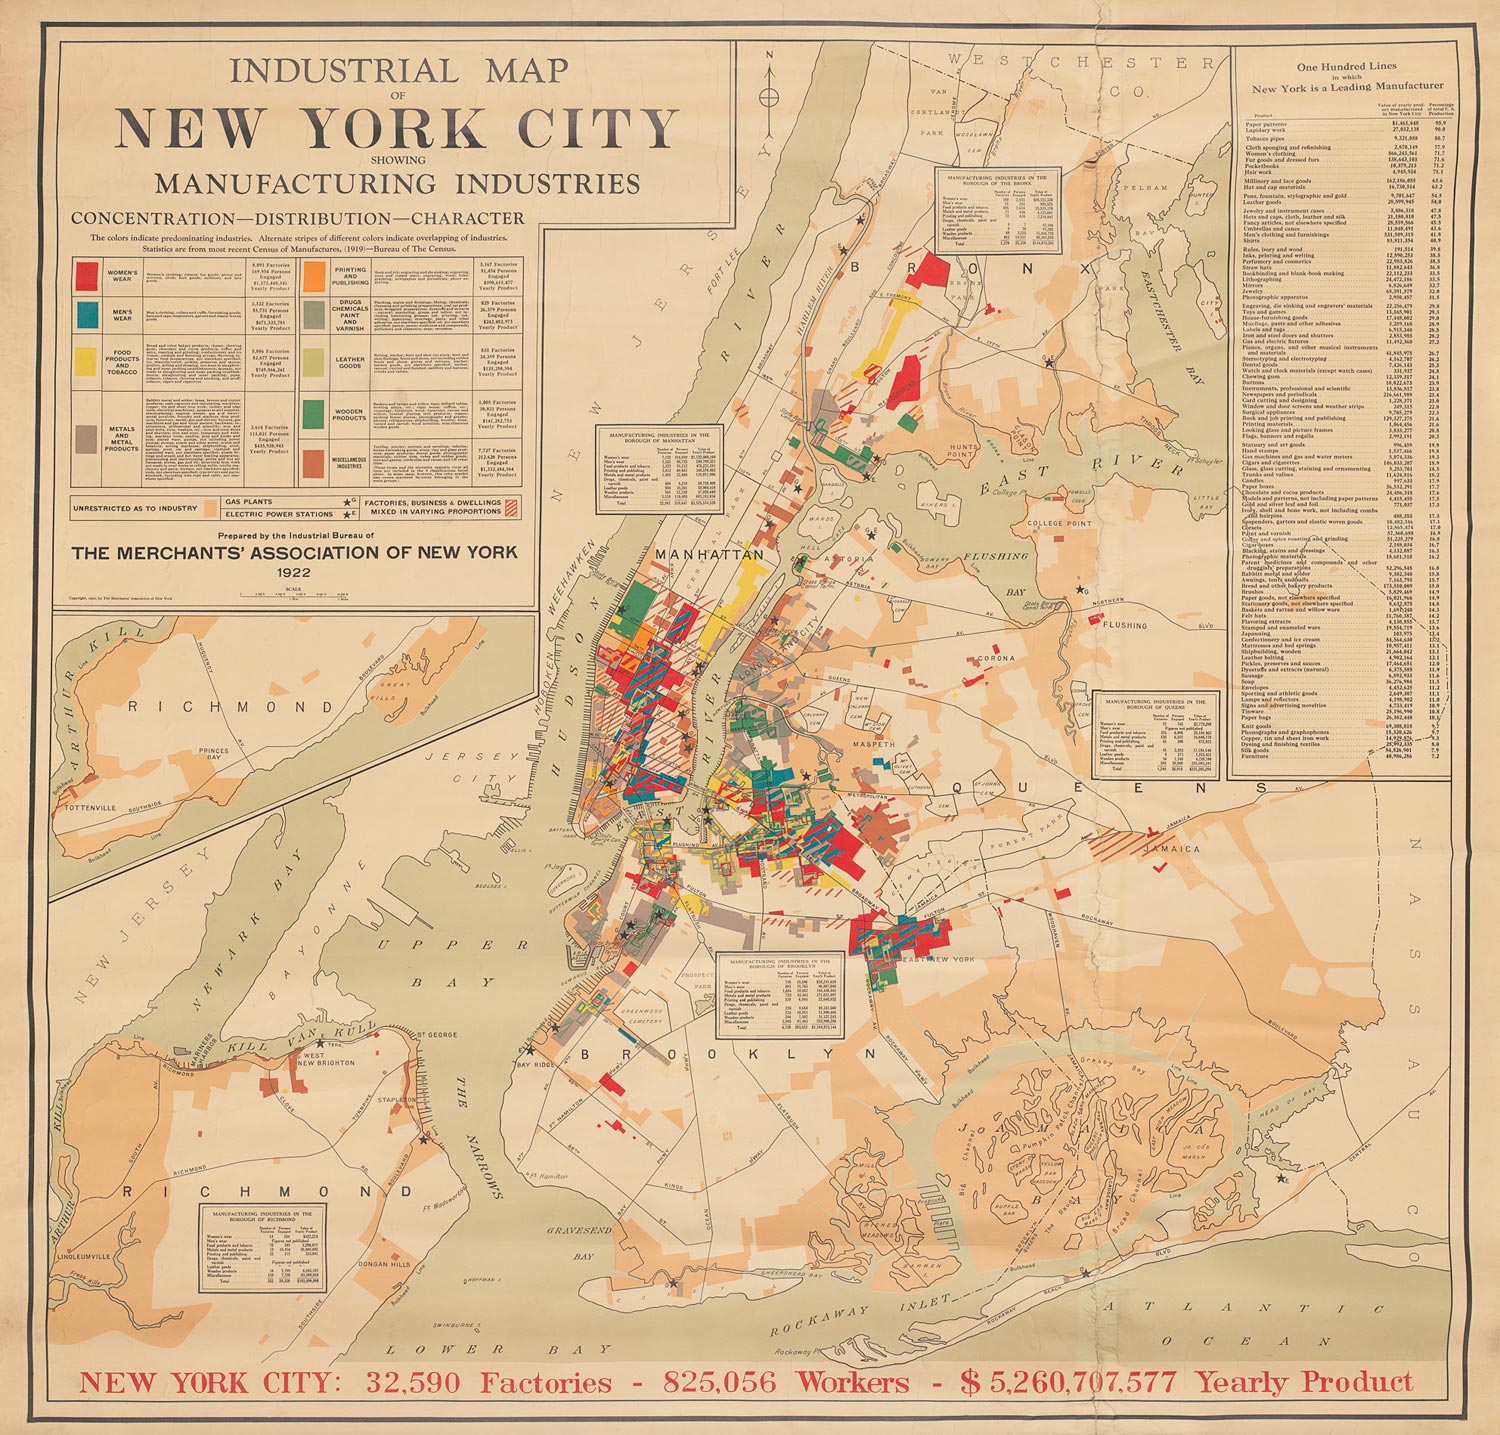
This analysis will use the worksheet to walk students through a step-by-step protocol for analyzing a map. Display the “Industrial Map of New York City” at the front of the classroom and/or distribute large format copies to students. Distribute the “Industrial Map Worksheet” and the “Map Analysis Protocol Guide” to the class and direct students to complete Step 1a only (title, authorship, date of publication, and place of publication). Explain to students that it is important to understand the sources of maps and other graphical representations of data. This is because understanding the origins of the material can help us understand if there is a point of view or bias embedded in the map. Understanding who made the map may also help clarify the goal of creating the map. For example, we may learn different things about the history of housing from insurance surveys versus the census. Have students work individually for two minutes, writing down everything they notice. Then, share-out responses for two minutes.
Repeat the process above for Step 1b. (See Step 1b on “Map Analysis Protocol” sheet)
Have students complete Step 2 of the “Map Analysis Protocol” sheet. Students should be encouraged to continue their observations for the full two minutes. Once done, share-out responses and have students add the ideas of their classmates to their notes.
Ask students to complete Step 3 of the “Map Analysis Protocol.” Have them consider the historical significance following the same process and timing of step 2.
What does the “Industrial Map of New York City” reveal about the time period during which it was produced?

